
Mastering Data Visualizations with Tableau
August 18, 2024 2025-06-24 15:18Mastering Data Visualizations with Tableau


Tableau Training Course | Data Visualization Certification India

Create Stunning Dashboards with Tableau Expertise
Why Join Mastering Data Visualizations with Tableau?
Acquire In-Demand Skills
Hands-On Learning
Career Advancement
Up-to-date Knowledge
Upcoming Batch:-
19th January 2025 (10pm to 1 am )
1st of February 2025 (10 pm to 1 am)
Mastering Data Visualizations with Tableau Overview
This program delves into essential tools for managing and visualizing data. It begins with the fundamentals of querying and manipulating relational databases using a standardized language, then progresses to mastering a leading platform for creating interactive and dynamic dashboards. The program is designed to provide practical experience, helping you build proficiency in both data management and effective visualization techniques. Through a series of comprehensive modules, you’ll gain the skills needed to handle complex data tasks and present insights in a compelling way.
ENROLL NOW & BOOK YOUR SEAT AT FLAT 50% WAIVER ON FEE
Batch Schedule
| Batch | Batch Type |
|---|---|
| Online Live Instructor Led Session | Full-Time |
| Online Live Instructor Led Session | Part-Time |
Regional Timings
| Region | Time |
|---|---|
| IST (India Standard Time) | 09:00 PM – 12:00 AM |
| Bahrain, Qatar, Kuwait, Saudi Arabia | 06:30 PM – 09:30 PM |
| UAE / Oman | 07:30 PM – 09:00 PM |
Talk to our Corporate training advisor
Mastering Data Visualizations with Tableau Objectives
The primary goal of this program is to equip you with robust skills in both data management and visualization. You’ll learn to proficiently query and manage relational databases using a standardized language, while also becoming adept at creating insightful and interactive dashboards with a leading visualization platform. By the end of the program, you’ll be able to transform raw data into meaningful insights and present them effectively, enhancing your capability to manage and communicate data-driven findings clearly and compellingly.
Why Learn Mastering Data Visualizations with Tableau ?
Master Essential Skills
Enhance Data Visualization
Transform Data into Insights
Increase Marketability
Hands-On Experience
Comprehensive Learning
Boost Analytical Skills
Program Advantages
Mastering Data Visualizations with Tableau Certification
Mastering Data Visualizations with Tableau Learning Path/Curriculum
Lecture 01: Orientation Session (Introduction to Business Intelligence)
Lecture 02: Basics of Database, Types of Database, Data Types, SQL Operators, Expression, Create, Insert
Lecture 03: Drop, Truncate, Delete, Alter, Update, Select, Range, Operator, IN, Wildcard, Like, Clause
Lecture 04: Constraint, Aggregation Function, Group by, Order by, Having
Lecture 05: Joins, Case, Complex Queries, Doubt Clearing
Lecture 06: Tableau Desktop, Tableau Products
Lecture 07: Data Import, Measures, Filters
Lecture 08: Data Transformation, Marks, Dual Axis
Lecture 09: Manage Worksheets, Data Visualization, Dashboarding, Project
Lecture 10: Project Session
Mastering Data Visualizations with Tableau Skills Covered
Mastering Data Visualizations with Tableau Tools Covered


Mastering Data Visualizations with Tableau Program Benefits
Develop In-Demand Skills
Gain expertise in key tools and technologies that are highly sought after in the data and analytics industry.
Hands-on Experience
Engage in practical, real-world projects that build confidence and competence in handling complex data tasks.
Boost Career Prospects
Enhance your employability with certifications that demonstrate your proficiency in essential data management and visualization tools.
Stay Current
Learn from an up-to-date curriculum that reflects the latest industry standards, ensuring your skills remain relevant.
Customized Learning
Tailor the program to fit your specific career objectives and interests, allowing for focused skill development.
Effective Communication
Learn to transform data into clear, actionable insights that can be effectively communicated to stakeholders.
Comprehensive Support
Benefit from extensive learning resources, including tutorials, forums, and personalized guidance, to help you succeed.

Career Opportunities after this course
-
SQL Developer
-
Reporting Analyst
-
IT Consultant
-
Data Visualisation Specialist
-
Data Analyst
-
Business Intelligence Analyst
-
Business Analyst


Projects that you will Work On
Practice Essential Tools
Designed By Industry Experts
Get Real-world Experience
Job Obligation after this course
We can apply for jobs in
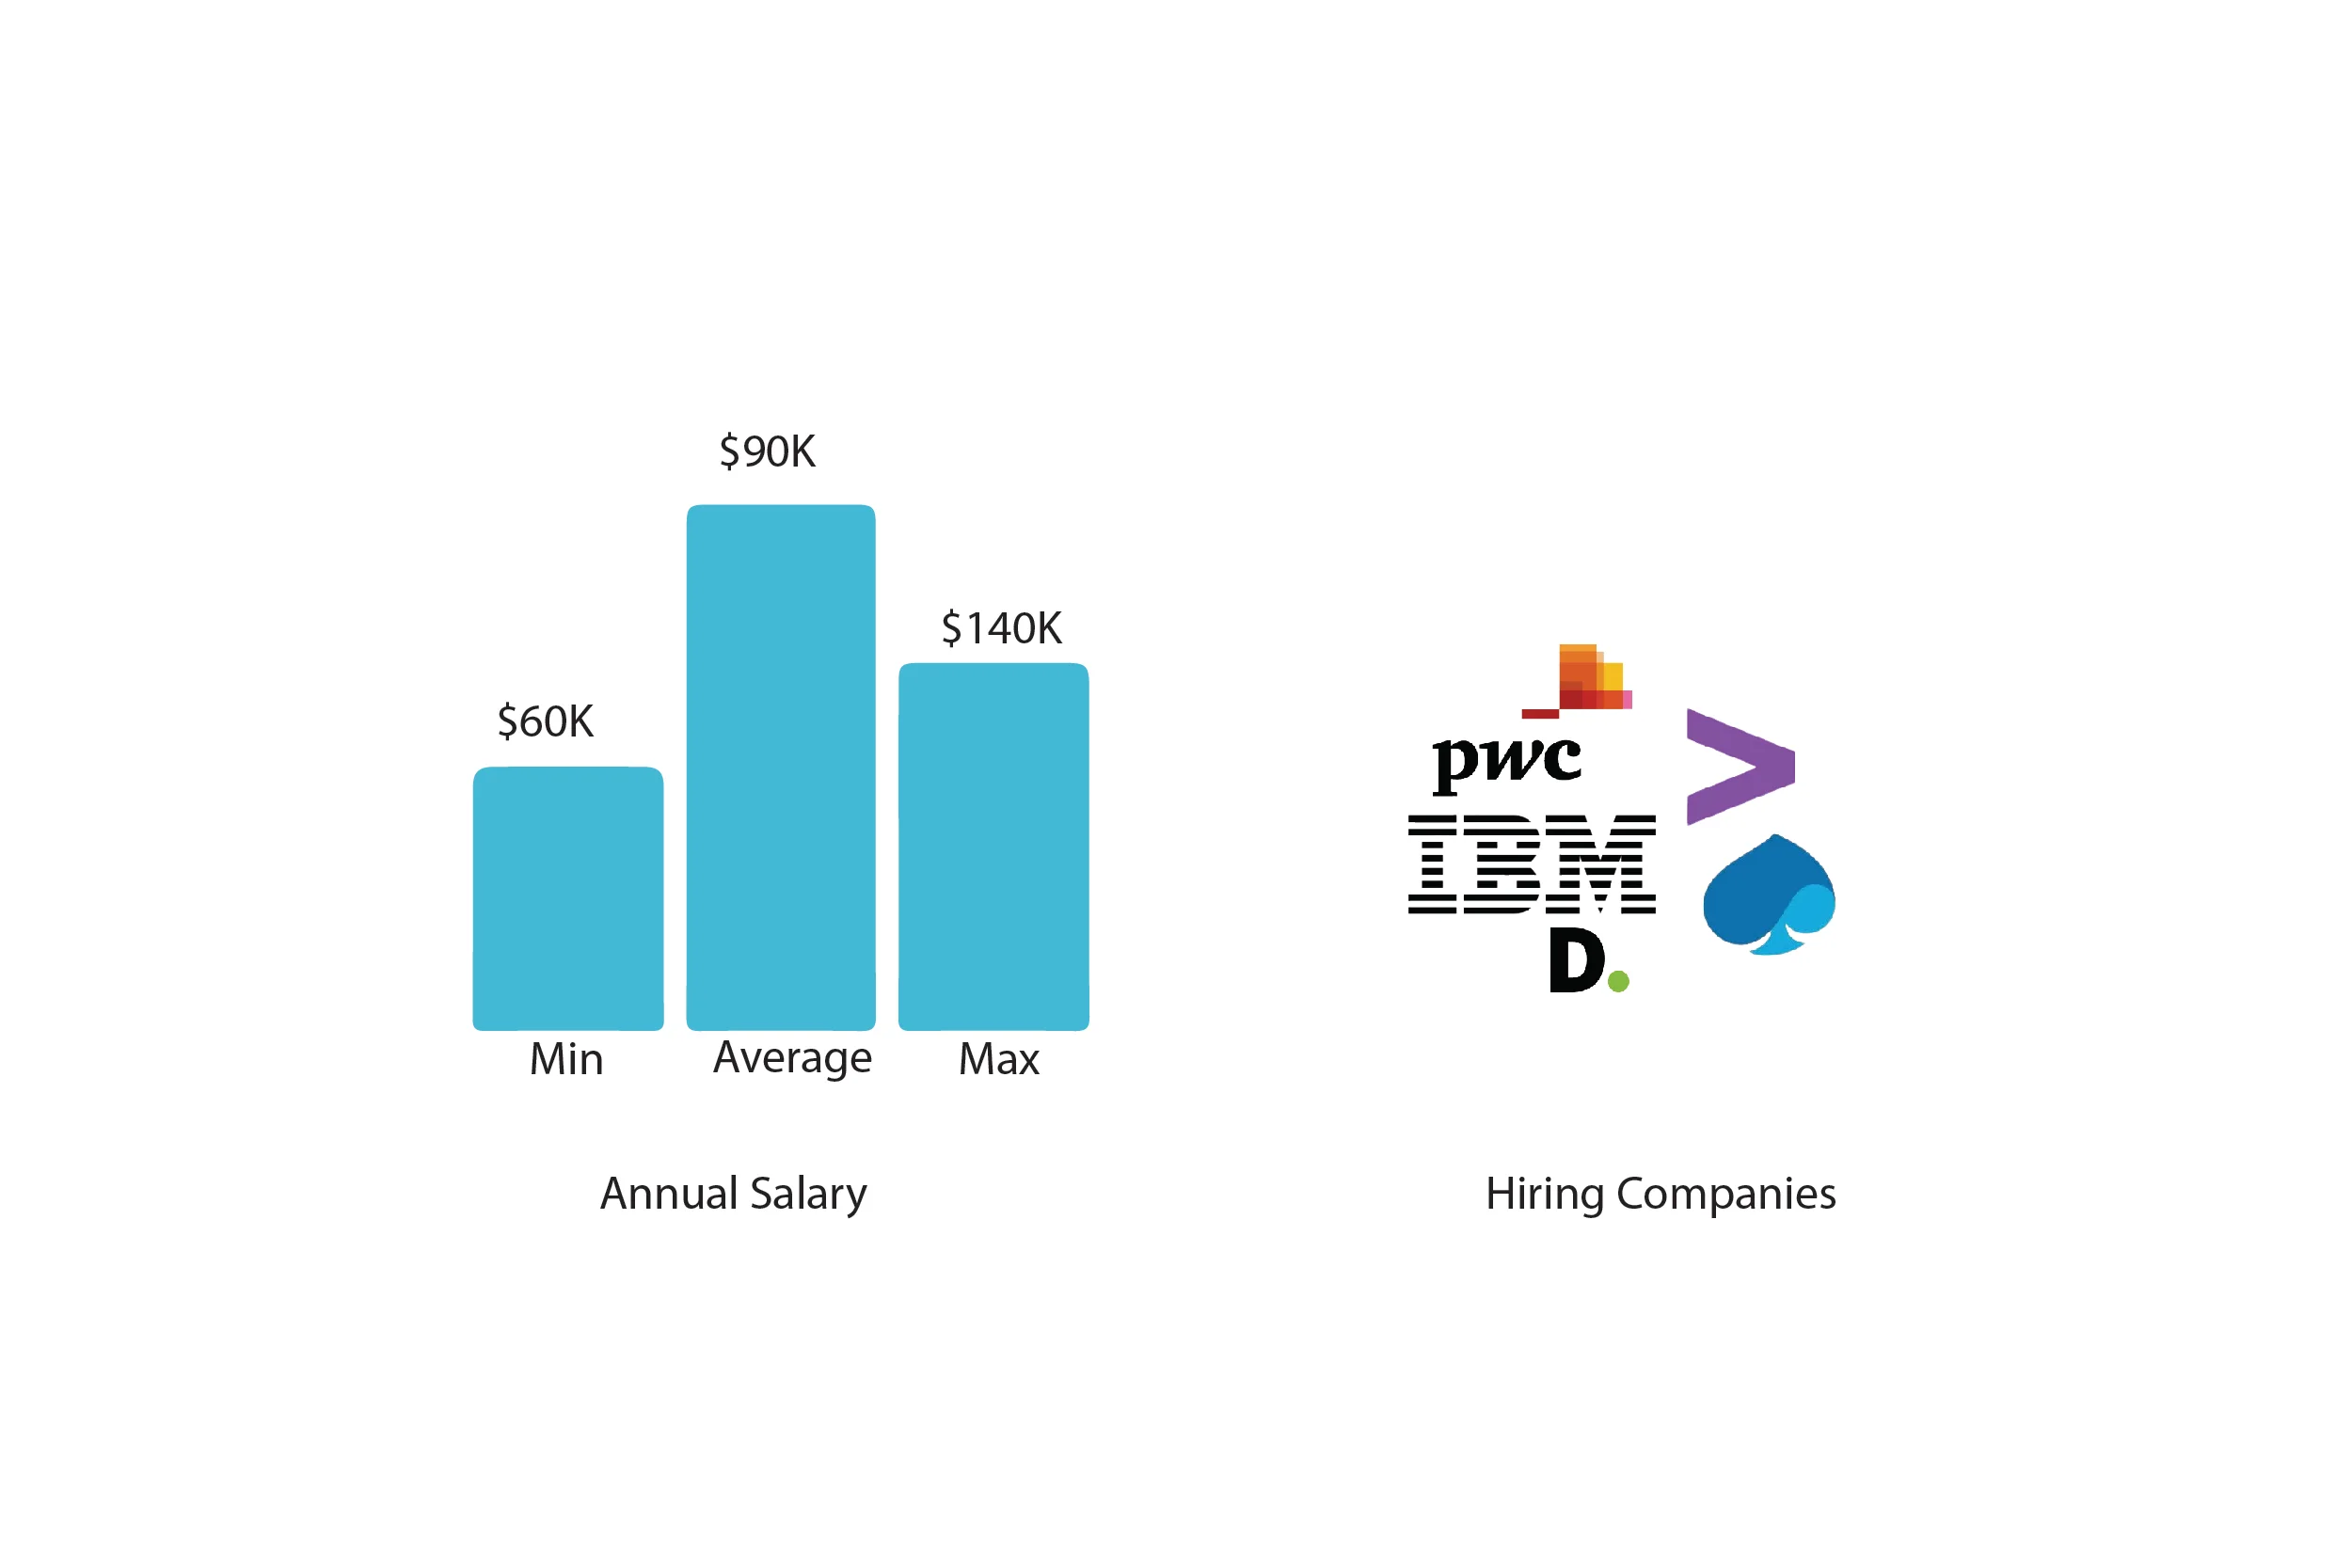
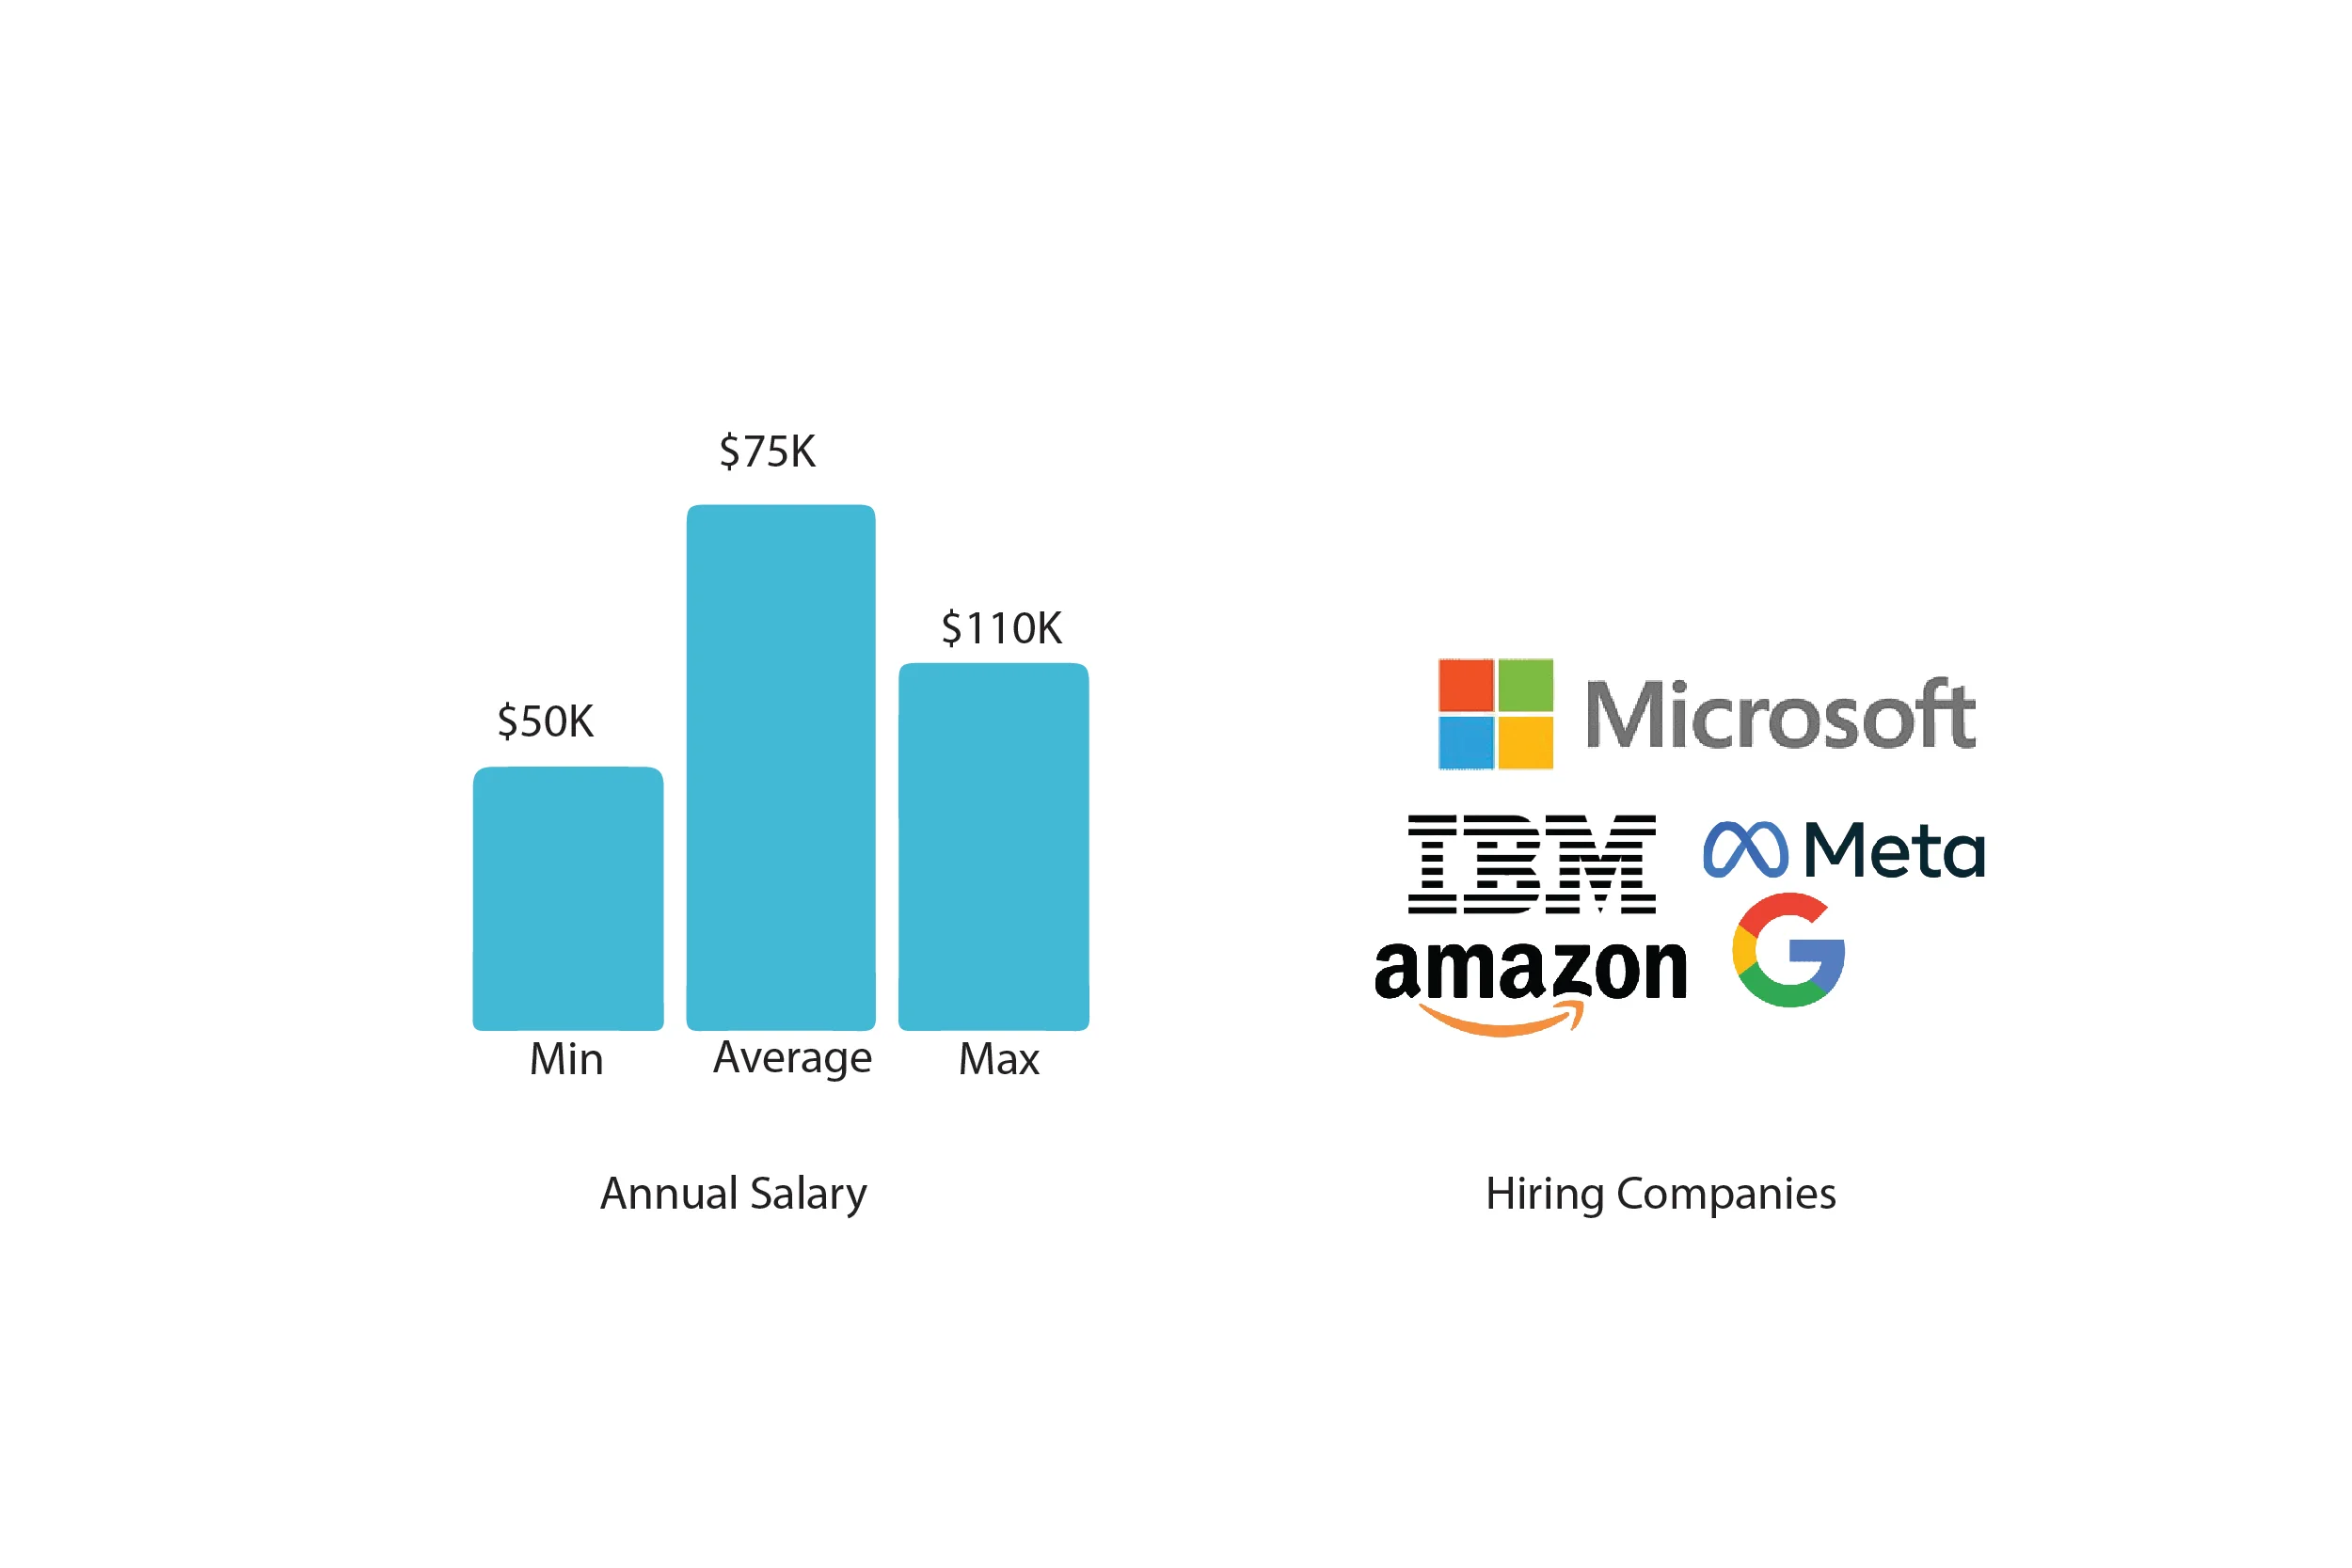
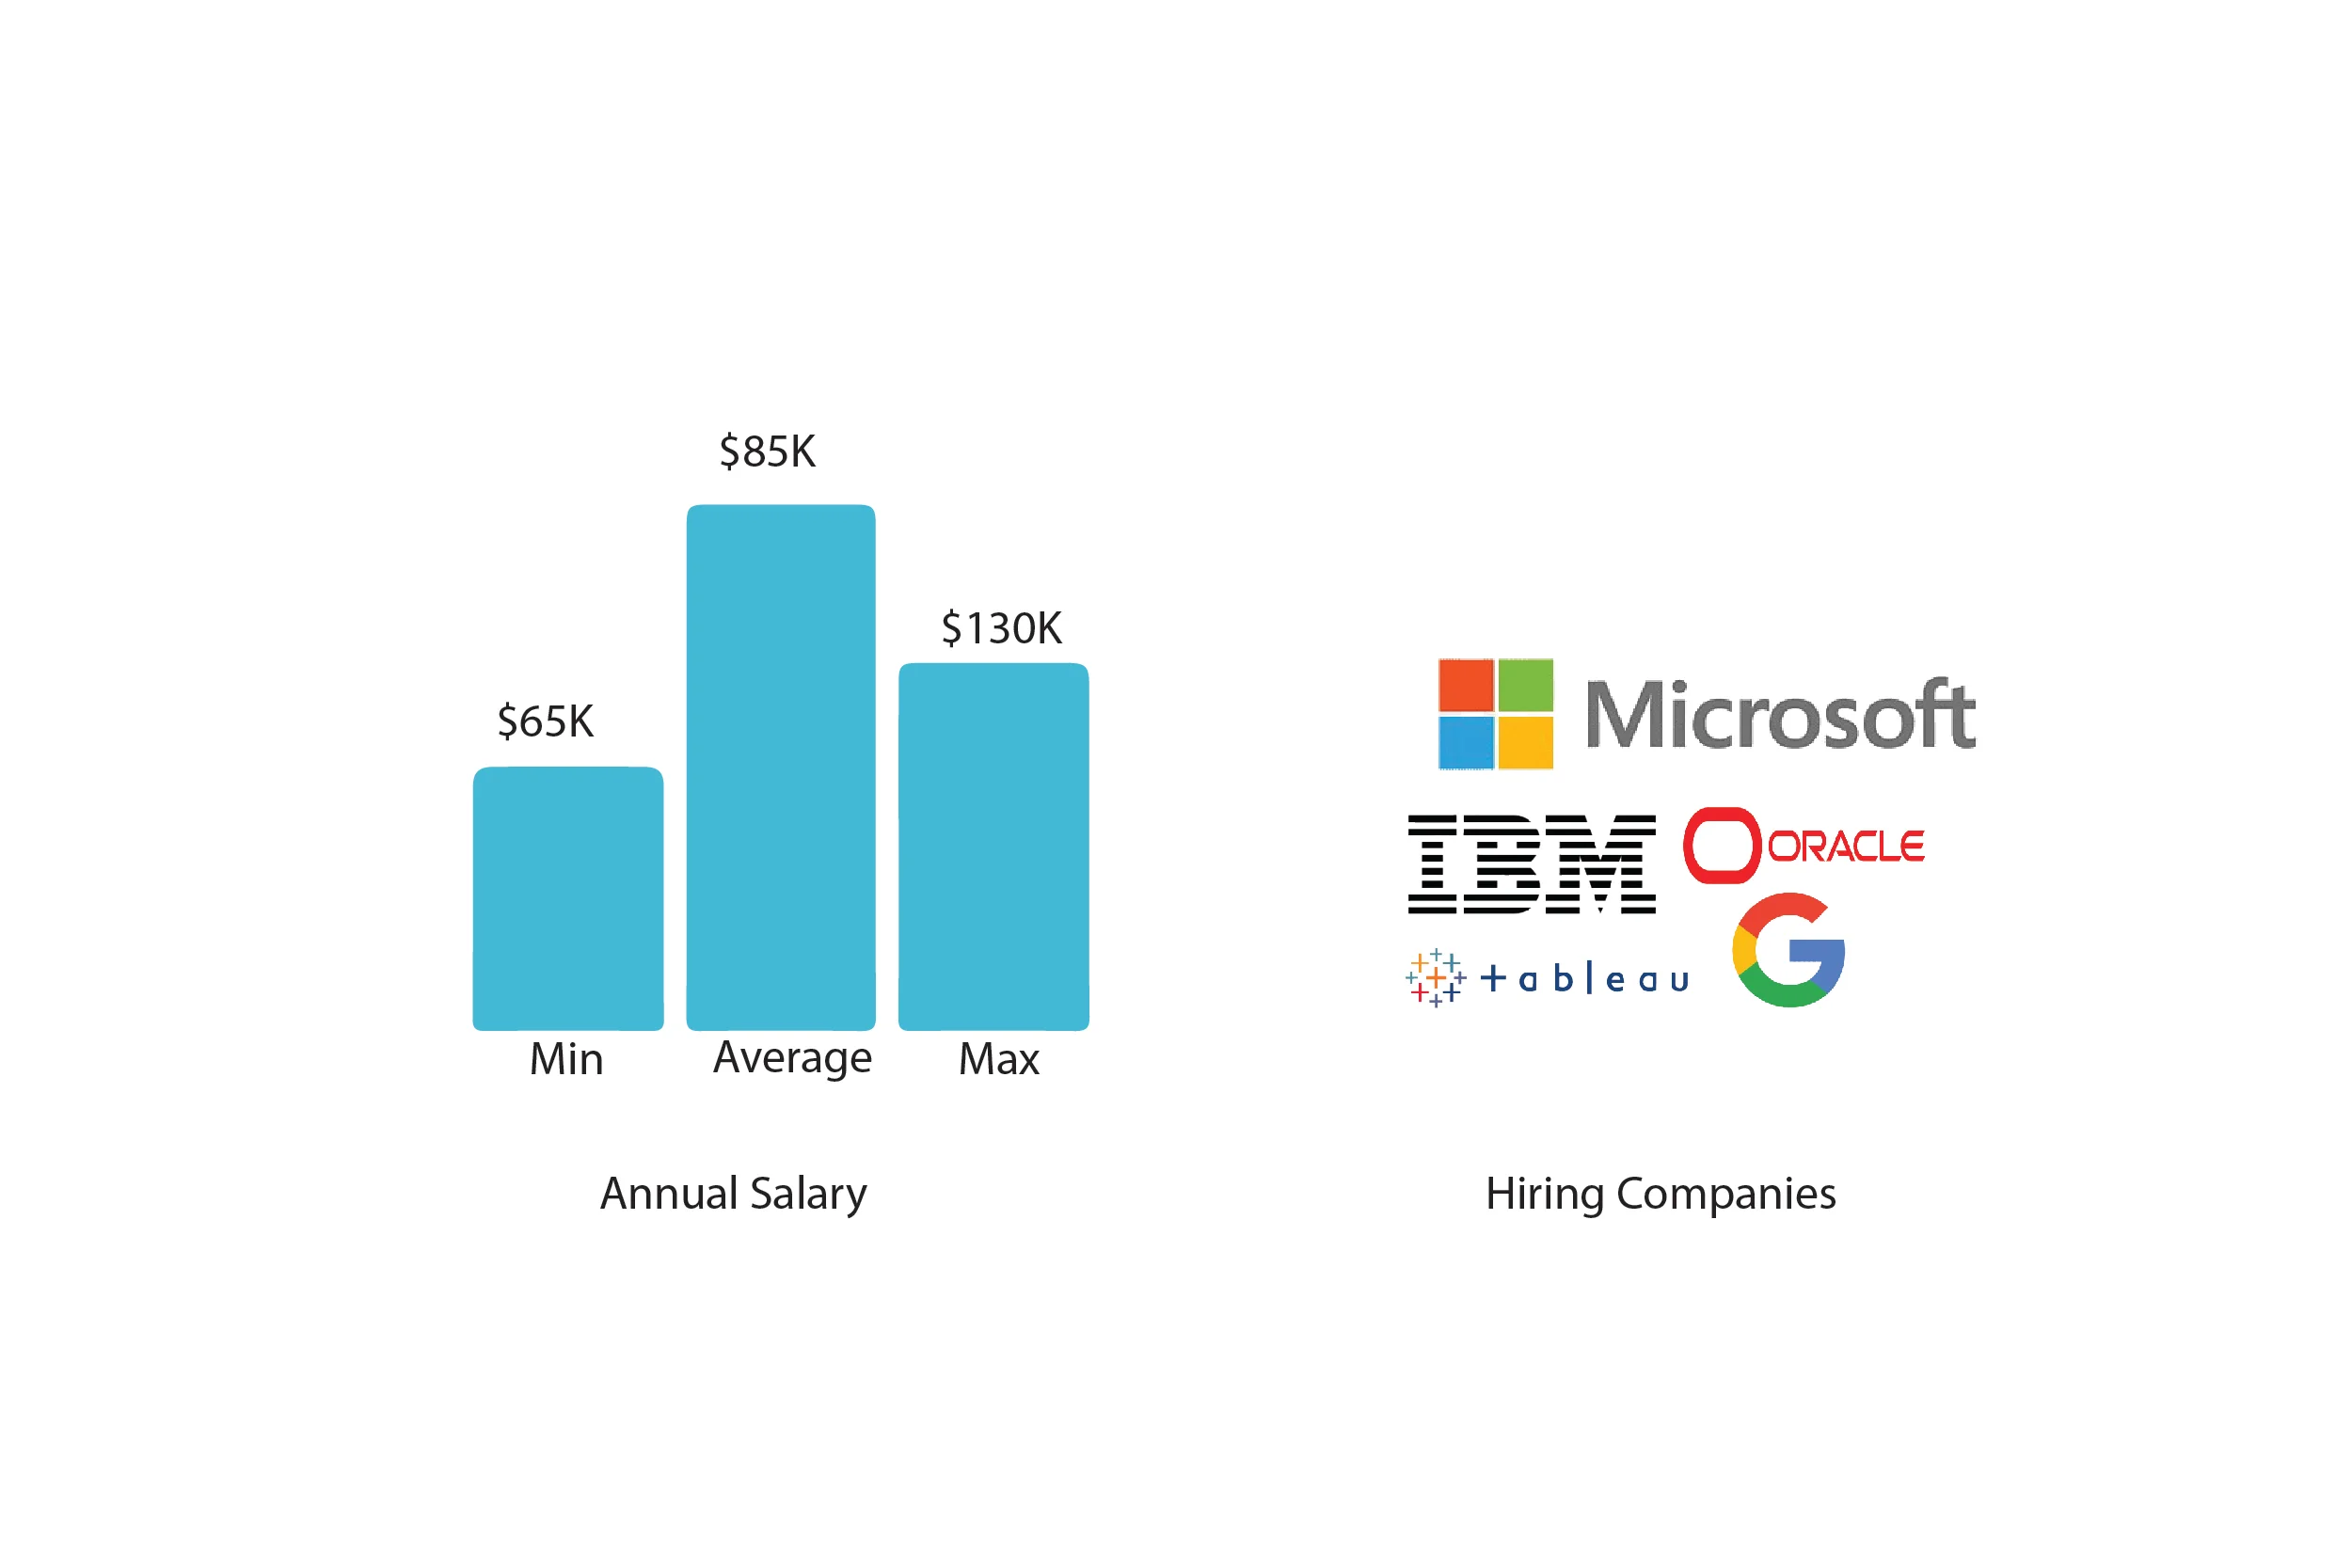
Companies Hiring for this course
Program Advisors
IITs
IIMs
NITs
Experts from the IT Industries.
Admission Details
The application process consists of three simple steps. An offer of admission will be made to selected candidates based on the feedback from the interview panel. The selected candidates will be notified over email and phone, and they can block their seats through the payment of the admission fee.

Course Fees & Financing
Course Fees
(50% OFF upto 31ˢᵗ March)
(Inclusive Of All Taxes)
Payment Partners
We partnered with financing companies to provide competitive finance option at 0% interest rate with no hidden costs


Upcoming Batches/Program Cohorts
| Batch | Date | Time | Batch Type |
|---|---|---|---|
| Online Live Instructor Led Session | 5th April 2025 | 10:00 AM | Full-Time |
| Online Live Instructor Led Session | 29th March 2025 | 02:00 PM | Part-Time |
Comparison with Others
| Feature | This Program | Other Programs |
|---|---|---|
| Comprehensive Curriculum | Covers both data management and visualization tools in-depth. | Often focuses on either data management or visualization, not both. |
| Hands-On Projects | Includes real-world projects with practical applications. | May offer limited hands-on experience or theoretical exercises. |
| Up-to-Date Content | Regularly updated to reflect current industry trends and technologies. | May have outdated content that doesn’t align with the latest industry practices. |
| Customization | Flexible learning paths tailored to career goals. | Typically offers a one-size-fits-all curriculum with limited customization. |
| Certifications | Provides recognized certifications that enhance career prospects. | Certifications may not be as widely recognized or industry-aligned. |
| Support Resources | Extensive support, including tutorials, forums, and personalized assistance. | Limited access to support, often restricted to basic resources. |
| Expert Instructors | Led by experienced industry professionals with deep expertise. | Instructors may lack industry experience or practical knowledge. |
| Networking Opportunities | Facilitates connections with peers, professionals, and instructors. | May have fewer opportunities for networking and collaboration. |
| Real-World Relevance | Curriculum and projects aligned with real-world data scenarios. | Often less focused on practical, real-world applications. |
| Interactive Learning | Engaging and interactive modules that enhance understanding. | May rely heavily on lectures with less interactive content. |
Self Assessments
Mastering Data Visualizations with Tableau Training Faqs
Establishes connections with several data sources, including spreadsheets, databases, and cloud services.
Drag-and-drop Interface: Simple to use; simple visualizations may be created without any code.
Create dynamic and interactive visualizations using interactive dashboards.
Real-Time Analysis: Facilitates data updates and analysis in real-time.
Types of Visualization: Provides a range of maps, graphs, and charts.
Data Blending: Merge information from several sources.
Collaboration and Sharing: Dashboards may be easily embedded and shared.
Advanced Analytics: For advanced analysis, integrate with R and Python.
Performance: Designed to efficiently handle huge datasets.
Entry-level: 5-9 lakhs per annum
Mid-level: 9-15 lakhs per annum
Senior-level: 15+ lakhs per annum
Easily navigate and manipulate objects using the drag and drop feature.
Connects to several data sources via data connectivity.
Advanced Visualizations: Maps, graphs, and interactive charts.
Live data connections and updates are known as real-time analytics.
Calculated Fields: Personalized computations and modifications.
Collaboration and Sharing: Simple teamwork and sharing.
Integration: Compatible with cloud services, R, Python, and SQL.
Optimizing performance: Managing big datasets effectively.
Security: Strict access control and data security.
Training and Assistance: Plenty of materials and local assistance.
1, we will optimise linked in profile and the algorithm of linkedin profile
2, We will conduct GITHUB and Kaggle sessions
3, We will do multiple Hackathons and guide you in problem solving skills for the interview process.
4, We will ensure peer learning session are being conducted
5, We will issue mini certification for every tools.
6,We will asign you a personal mentor on pre booking i’t a one one session.


